Hansen: Yes, 2026 is on Track to be the Hottest Year
Authors: James Hansen, Pushker Kharecha, Dylan Morgan and Jasen Vest
Abstract
Source: Projections of near-term climate change are a potential research tool. However, for that tool to be most useful, the physical basis for a prediction must be made clear. The basis for our projection of record 2026 global temperature is high climate sensitivity, with its implication that aerosol cooling was still increasing during the period 1970-2005. One consequence, global sea surface warming, already has important effects. Causes of climate change must be understood for policy purposes. Figures in this post and our recent papers are continually updated on our website.[1] We are also now on Substack[2].
Prognosticators such as Nostradamus and the Wizard of Oz need not explain the basis of their opinions, as they are entertainers or charlatans. All others, at least with climate projection, should define the basis for their projection, so that their efforts contribute to improved understanding. In our post[3] on 30 April, we concluded that 2026 global temperature will exceed the 2024 level, despite the fact that 2026, so far, has been running substantially cooler than 2024 (Fig. 1). Our projection was that the 2026 temperature (the red curve in Fig. 1) would pass the 2024 monthly temperature in midyear and then exceed 2024 monthly temperature in the remainder of the year by an amount large enough to make 2026 the hottest year, eclipsing the 2024 record.
![Fig. 1. Global surface temperature anomaly in GISS analysis[4] relative to 1880-1920 mean.](https://earthclimate.eu/wp-content/uploads/2026/06/Hansen-et-al-Figure-1-Warming-Compared-2024-with-2026.jpg)
Fig. 1. Global surface temperature anomaly in GISS analysis relative to 1880-1920 mean.

Watch the Video
1. Our projection of record warmth in 2026
For the era of instrumental temperature data) is a physics-based assessment deriving ultimately from our prior conclusion that climate sensitivity is higher than the best estimate of IPCC (Intergovernmental Panel on Climate Change) and from a concomitant but physically independent conclusion that IPCC underestimated aerosol cooling during the 1970-2005 period of steady global warming. Our assessment that climate sensitivity is 4-5°C for 2×CO2 is derived in four independent ways that we summarize below.
Our scientific papers[5],[6] evoked a strange response from several scientists who serve as public faces of the modeling community: ad hominem criticisms, but no response to the scientific issues that we raised. We have called out[7] this odd response to draw attention to failure of the media to provide quality science reporting on climate change. Given the enormous implications of climate change for the public, especially young people, it is incumbent on the media to ask questions of scientists and demand understandable scientific explanation of their conclusions.
Predictions that can be tested against subsequent reality provide an effective way to advance scientific understanding of a given issue, as well as the public’s appreciation of that issue and the scientific method. Good opportunities for predictions – such as a large volcanic eruption – do not come along frequently, so we should not miss the opportunities that arise. The El Nino expected this year provides such an opportunity. The purpose of our prediction that 2026 will be the warmest year in modern history (with 2027 still warmer) is to use this opportunity for better understanding. For this approach to be most useful, the physical bases for our prediction and contrary predictions should be well-defined.
An article in the Washington Post last week reported that “climate scientists” peg the odds as 27% that 2026 will be the record warmest year. Perhaps the author was unaware of our 30 April Substack post “2026 On Track for Warmest Year” or perhaps he does not consider us to be climate scientists worth acknowledging. In any case, this year provides a chance to learn something from contrary predictions. The Washington Post article refers to a projection of Zeke Hausfather on 2 June that there is a 26.6% chance of 2026 being the warmest year. Zeke has provided enough information to allow a contrast with our approach.
Below we describe the basis for our prediction and our principal differences with Hausfather. Based on this scientific evidence, we expect that when the horse race comes down the stretch, in November and December of this year, we will be riding a thoroughbred, a strong young horse, and Zeke will be atop a fading old nag. In any event, we will then be able to assess whether we have learned anything that helps young people define policies to create a bright future.
2. Significant progress in understanding climate change was made in the past several years
As we described in our recent papers,[5],[6] the most important result is that climate sensitivity is significantly higher than the long-standing best estimate of 3°C for 2×CO2, a conclusion we can state with greater than 99% certainty. Jessica Tierney made the first major contribution, showing that the last major ice age (20,000 years ago) was about 6°C colder than the present interglacial period,[8] rather than about 4°C, as long assumed. Tierney improved on prior analyses by excluding data based on a dubious assumption about migration of biological species in the ocean.[9] Matt Osman, similarly, showed that the peak of the ice age was about 7°C colder.[10]
Alan Seltzer provided the clinching data: noble gas amounts in groundwater deposited during the ice age were 6°C colder for the latitude range 45°S-35°N.[11] This result for limited land area must be adjusted to account for temperature change of ocean being less than on land and the fact that temperature change at high latitudes exceeds that at low latitudes; these two adjustments almost exactly offset each other.[5] Also, we must adjust for the large ice sheets that existed in the ice age at high latitudes; the additional cooling from ice sheets increased global cooling to about 7°C, consistent with the Tierney and Osman results.
This comparison of two equilibrium climate states, the last ice age and the present interglacial period, provides the best measure of climate sensitivity: 4-5°C for doubled carbon dioxide.[5] There are three additional independent assessments of climate sensitivity, which support this estimate. We number these 2-4 and order them from the most to the least quantitatively helpful.
The 2nd source of information is the large reduction of Earth’s albedo (reflectivity) in the period of precise satellite data that began in year 2000. The albedo reduction is so large that most of it must be due to a reduction of sunlight reflected by clouds, as the contributions from reduced sea ice cover and reduced human-made atmospheric aerosols are relatively small.[6] This implies that cloud changes are a strong, amplifying, climate feedback. If cloud changes were neutral (no net warming or cooling effect), climate sensitivity would be about 2.4°C for doubled carbon dioxide because water vapor and sea ice feedbacks roughly double the no-feedback climate sensitivity of 1.2°C. The large cloud feedback implies a climate sensitivity of at least 4°C. These albedo observations will provide a more precise evaluation of climate sensitivity as the record becomes longer.The 3rd source of information is knowledge of when the Earth was last a snowball.[12],[13] The Sun is an ordinary star of modest mass, “burning” hydrogen in nuclear fusion, slowly becoming brighter at a rate of 1 percent per 100 million years. The last “snowball Earth,” when ice reached sea level at the equator, was about 600 million years ago. A 2 percent change of solar irradiance is a climate forcing equivalent to that of doubled carbon dioxide. Thus, the 6 percent change of the Sun’s brightness since the last snowball is equivalent to three doublings of carbon dioxide. The fact that only a 6 percent solar irradiance change is needed to cause snowball Earth implies that climate sensitivity is high, about 4-5°C for doubled carbon dioxide, and Earth system sensitivity (including ice sheet changes neglected in Charney’s sensitivity) is even higher.[14]
The 4th source of information on climate sensitivity is observed global warming over the past 1-2 centuries, which is the focus in IPCC reports. This is the least reliable of the four sources because it requires knowledge of the net climate forcing that drove the global warming. There are two large climate forcings in that period: human-made greenhouse gases and human-made aerosols, but the aerosol forcing was not measured. Most global warming occurred post-1970 at a steep rate of almost 0.2°C per decade (Fig. 2). During that period of rapid warming, IPCC’s best estimate of aerosol forcing (Fig. 3) is essentially unchanging; in that case, climate sensitivity near 3°C for 2×CO2 provides the best match to observed warming.
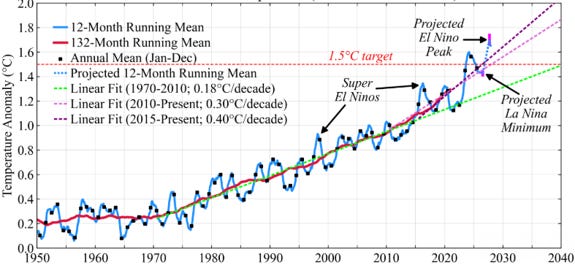
Fig. 2. Global surface temperature (relative to 1880-1920 base period).
IPCC’s aerosol forcing (Fig. 3) is almost exactly proportional to estimated global SO2 emissions (Fig. SM1 of reference 6). Sulfates produced by SO2 emissions are the principal anthropogenic aerosol, but it is unlikely that global aerosol climate forcing is proportional to SO2 emissions. Aerosol scientists describe the great uncertainty in the aerosol forcing in IPCC reports. The largest uncertainty is in the effect of aerosols on cloud formation and cloud properties. This “indirect” aerosol forcing is known to be nonlinear, as additional emissions in highly polluted air have little effect on clouds. Global average SO2 emissions changed little between 1970 and 2005, as decline of U.S. and European emissions was balanced by increased emissions in East Asia. Emissions from ships also spread over a greater area.
The greater spread of emissions makes it likely that the (negative) aerosol forcing increased in 1970-2005. The more realistic of two aerosol-cloud models of Susanne Bauer et al.[15] has an increase of aerosol cooling during 1970-2005 of ~0.5 W/m2, which requires climate sensitivity 4.5°C for 2×CO2 to match the observed global warming. The alternative, presumably less realistic Bauer aerosol-cloud model, yields an increase of aerosol cooling of ~1 W/m2 over 1970-2005, which requires climate sensitivity 6°C for 2×CO2 to match observed global warming. Independently, we show that, among the three aerosol coolings (0, 0.5, 1 W/m2), the intermediate case (implying climate sensitivity 4.5°C for 2×CO2) provides the best representation of total temperature change for 1880-present.[6]
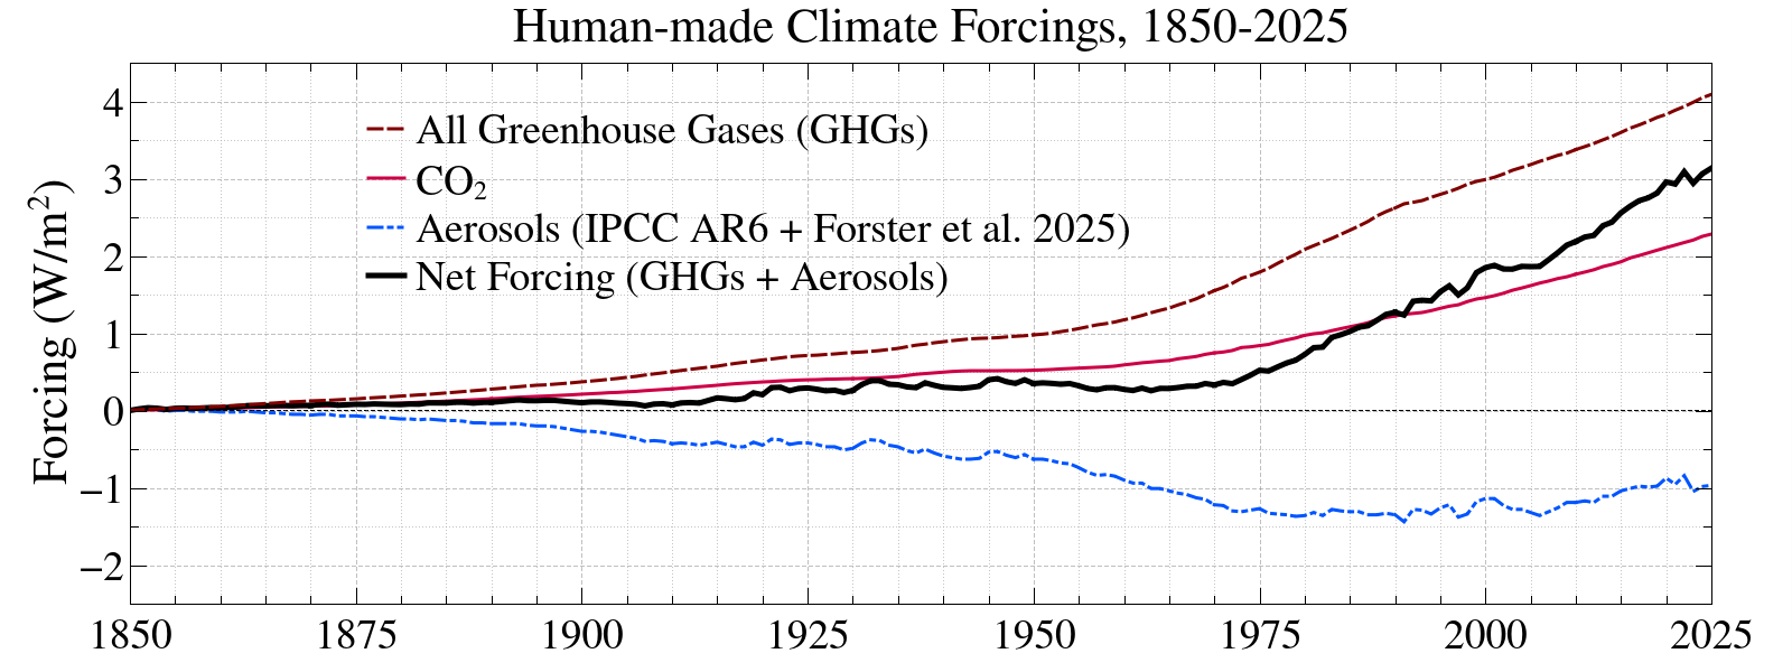
Fig. 3. All Greenhouse gases, CO2, aerosol, and net climate forcings.
![Fig. 4. Earth’s satellite-observed absorbed solar radiation (ASR) and longwave (thermal) emission to space (LW),[18] both relative to their 2000-2010 averages, and the absolute Earth energy imbalance (EEI) calibrated with aid of Argo-measured heat storage in the ocean.](https://earthclimate.eu/wp-content/uploads/2026/06/Hansen-et-al-Figure-4-Earth-satellite-observed-absorbed-solar-radiation-longwave.jpg)
Fig. 4. Earth’s satellite-observed absorbed solar radiation (ASR) and longwave (thermal) emission to space (LW),[18] both relative to their 2000-2010 averages, and the absolute Earth energy imbalance (EEI) calibrated with aid of Argo-measured heat storage in the ocean.
3. Understanding of ongoing climate change is needed for policy reasons
Our interpretation of ongoing change differs sharply from that of IPCC. Consider round numbers. Greenhouse gas (GHG) forcing increased ~0.45 W/m2 per decade (Fig. 3), but increased (negative) aerosol forcing of ~0.5 W/m2 in 1970-2005 decreased the net climate forcing to ~0.3 W/m2 per decade. In the last 10-15 years, aerosols decreased, making the recent growth rate of climate forcing at least double that in 1970-2005. That’s why global warming accelerated (Fig. 2) and Earth’s energy imbalance doubled (Fig. 4). We will get into quantitative interpretation in a future paper.
IPCC underestimates the role of aerosols in past and future climate because they underestimate the aerosol forcing. There was probably already a preindustrial aerosol forcing of at least 0.5 W/m2, presumably from human-made fires that at least offset the warming effect of increasing CO2 and CH4 during the past 6,000 years. Increasing aerosols as population increased provides the simplest explanation for the “Holocene conundrum,” the fact that there was no global warming, or even slight cooling, at a time when GHGs were increasing. However, the more important fact is that IPCC has underestimated aerosol forcing during the past 200 years as a result of their underestimate of climate sensitivity. As all astute climate modelers know, the unmeasured aerosol forcing has always provided the flexibility needed for models to achieve global warming consistent with observations in the Anthropocene.
The upshot is a double whammy. There is more warming in the pipeline than has been anticipated for two reasons. First, the negative aerosol forcing exceeds IPCC estimates, which will increase the warming as we clean up air pollution. Second, the warming will exceed the estimates that centered on a climate sensitivity 3°C for 2×CO2, because actual climate sensitivity is higher than that.
4. A strong El Nino is about to begin
We have shown in prior posts that the heat anomaly in the upper 300 m of the equatorial Pacific provides an El Nino diagnostic with more favorable characteristics than the common Nino3.4 SST (sea surface temperature) index. The 300 m heat provides an earlier indication of an upcoming change of tropical climate and it is less affected by human-made global warming. The present 3-month running mean (1-month mean for the final data point) of the 300 m heat is compared with three Super El Ninos on the left side of Fig. 5 and with three moderate El Ninos on the right.
Clearly, this will be a strong El Nino, well exceeding the moderate El Ninos with which it is compared on the right. Although it appears to be closely following the strongest of these Super El Ninos, several caveats should be noted. First, the present 300 m heat anomaly is surely increased by ubiquitous human-made warming, even though the magnitude of that effect should be less than that for the Nino3.4 SST. Even the human-made increase of SST matters because the magnitude of the SST anomaly relative to the surrounding climate presumably drives the Bjerknes feedback that causes the El Nino to grow and maintain its strong SST anomaly.
Other El Ninos tend to strengthen in late summer or fall, and that might not happen with this El Nino, which received an unusual kick from strong westerly winds associated with tropical cyclones. Also, weekly NOAA data show that the 300 m temperature has begun to decline, so it is conceivable that this El Nino could decline earlier than the prior strong El Ninos. Nevertheless, it is safe to conclude that this El Nino is a strong one.
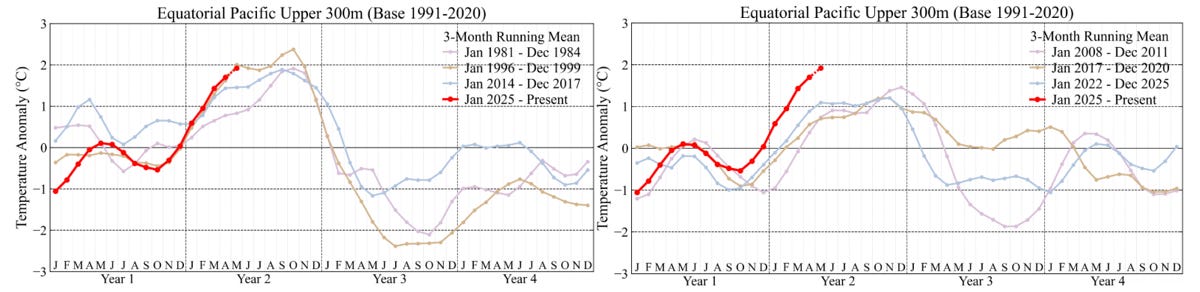
Fig. 5. Ongoing 300 m heat compared to (a) Super El Ninos, and (b) moderate El Ninos.
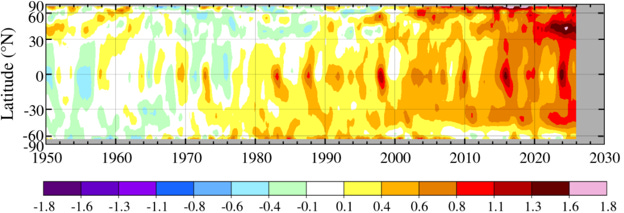
Fig. 6. Zonal-mean SST anomaly based on NOAA ERSSTv5 data as in GISS analysis.
5. Global SSTs are increasing rapidly, recently
One useful perspective is provided by zonal-mean anomalies relative to the 1951-1980 base period (Fig. 6). Largest warming is at middle latitudes, especially in the Northern Hemisphere, where we have argued that the aerosol forcing decline is especially significant.[6] Given high climate sensitivity of 4-5°C for doubled CO2, a substantial fraction of this warming is also from cloud feedback. However, feedbacks occur as an enhancement of warming. It is clear that unusual warming has occurred in the past 10-15 years. This acceleration can be seen more quantitatively in Fig. 7 for the globe and three latitude ranges. We have made the case that the acceleration is especially steep in regions where restrictions on sulfur content of ship fuels are most effective in reducing aerosol cooling.
For the purpose of predicting temperature in the remainder of 2026, we note in Fig. 8 that global SST in 2026 has approximately “caught” the 2024 global SST in May (upper figure) and 2026 continues to be at least 0.1°C warmer than in 2023 (the last El Nino onset year). We expect that gap to be maintained, as the upcoming El Nino is at least as strong as the one in 2023. We note also that Earth’s energy imbalance for the last 15 months of data (January 2025 through March 2026) is 1.58 W/m2, even higher than the prior decade (Fig. 4). The year 2026 should already exceed the 2024 record, with higher temperatures to come in 2027.
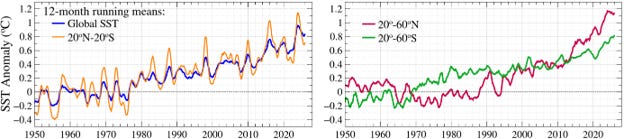
Fig. 7. Zonal-mean SST anomaly based on NOAA ERSSTv5 data as in GISS analysis
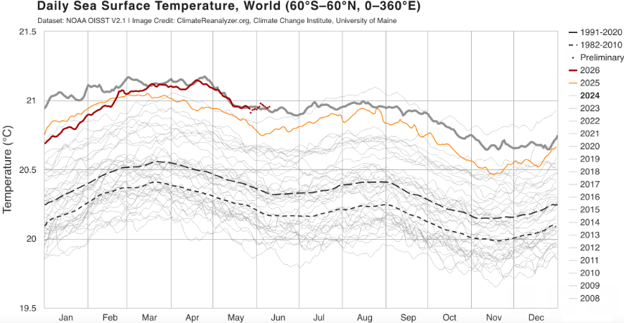
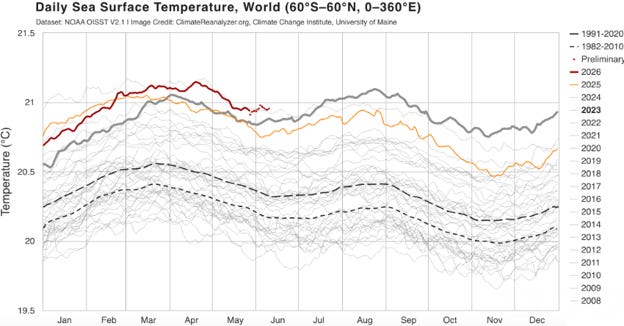
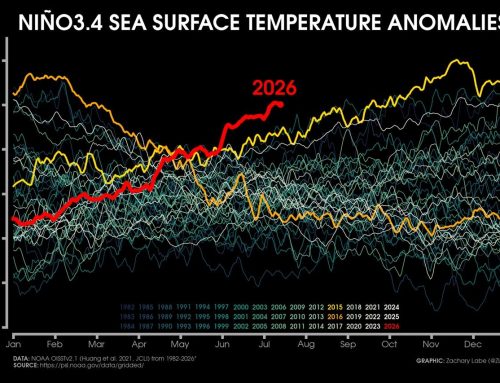
Fig. 8. NOAA OISST V2.1 Image Credit: ClimateReanalyzer.org, Climate Change Institute, University of Maine. The red curve is 2026; the heavy grey curves are 2024 (upper figure) and 2023 (lower figure).
6. Summary
The media are gobbling up and regurgitating an interpretation of global climate change that we believe is fundamentally flawed. The principal issues are related to the aerosol climate forcing and can be understood with reference to Fig. 3. The major problem with the IPCC best estimate of aerosol forcing in Fig. 3 is its near constancy in the period 1970-2005. If that were correct, it would imply that climate sensitivity is about 3°C for doubled CO2 (as needed to achieve global warming similar to observations). However, aerosol-cloud modeling suggests that aerosol forcing was still growing (becoming more negative) during that period, as aerosol sources became more widespread. If aerosol forcing increased ~0.5 W/m2 (our best estimate), it implies that climate sensitivity is 4-5°C for doubled CO2. We have presented extensive independent evidence that climate sensitivity is 4-5°C for doubled CO2. The implications of our interpretation are great. It means that we should expect more warming from decreased aerosols than IPCC would have us believe. More important, the high sensitivity means that there is more warming in the pipeline than IPCC’s best estimate of climate sensitivity would have us believe.
A secondary issue is the climate forcing caused by decreasing emissions from ships. We have presented evidence that ships are responsible for an increase of at least a few tenths of 1 W/m2 in the past decade. At least in this case, we can make a quantitative comparison with the IPCC estimate as Forster and Hausfather calculate 0.079 W/m2.[20] Observational data, in combination with improving aerosol-cloud modeling, should be able to resolve this difference. We believe that the larger effect that we estimate for ship aerosols is at least partially responsible for the sharp uptick in Earth’s energy imbalance and temperature shown in Figs. 4, 6 and 7.
It is hard to resolve the differences of opinion on the more important issue of climate sensitivity and global warming on the century timescale because the IPCC modeling approach and how it is used by Hausfather and others for their climate projections is foggy, i.e., not well defined. It seems to be based on the fog of model results produced by all climate models. However, the projections produced are continually changing; such is the case for 2026 global temperature. How are these determined? If we are to gain knowledge from real-world climate “experiments,” such as that occurring this year, we need to understand the basis for the predictions.
References
- [1] Our communications (posts) and data are available now via Hansen’s website while we continue to develop and populate our websites and data pages. Figures in communications and papers that remain of current interest will be updated at appropriate intervals, usually monthly, with the most recent date of update indicated on the website.
- [2] https://jimehansen.substack.com/
- [3] Hansen J, Kharecha P, Morgan D, Vest J. 2026 On Track for Warmest Year, 30 April 2026
- [4] Temperature is from Goddard Institute for Space Studies analysis described by Hansen J, Ruedy R, Sato M et al. Global surface temperature change, Rev Geophys 48, RG4004, 2010; Lenssen NJL, Schmidt G, Hendrickson M et al. A NASA GISTEMPv4 Observational Uncertainty Ensemble, J Geophys Res Atmos 129, e2023JD040179, 2024
- [5] Hansen JE, Sato M, Simons L et al. “Global warming in the pipeline,” Oxford Open Clim. Chan. 3 (1) (2023): doi.org/10.1093/oxfclm/kgad008
- [6] Hansen JE, Kharecha P, Sato M et al. Global warming has accelerated: are the United Nations and the public well-informed? Environ.: Sci. Pol. Sustain. Devel. 67(1), 6–44, 2025
- [7] Hansen J, Kharecha P, Morgan D, Vest J. Super El Nino? Super Warming is the Main Issue. 20 March 2026.
- [8] Tierney JE, Zhu J, King J et al. Glacial cooling and climate sensitivity revisited. Nature 584, 569-73, 2020
- [9] Tierney was able to exclude from her analysis the assumption that microbiota in the ocean do not adapt to temperature change, even over millennia. With that prior, dubious, assumption, ice age ocean temperatures were set based on the temperatures that a given species tolerates today.
- [10] Osman MB, Tierney JE, Zhu J et al. Globally resolved surface temperatures since the Last Glacial Maximum. Nature 599, 239-44, 2021
- [11] Seltzer AM, Ng J, Aeschbach W et al. Widespread six degrees Celsius cooling on land during the Last Glacial Maximum. Nature 593, 228-32, 2021
- [12] Hoffman PF, Schrag DP. The snowball Earth hypothesis: testing the limits of global change. Terra Nova 14, 129-55, 2002
- [13] Oscillations between snowball Earth and a nearly ice-free planet occurred several times prior to 600 million years ago, when the Sun was less bright. When Earth is ice and snow covered, weathering nearly stops. Weathering carries carbon and other chemicals to the ocean, resulting in formation of limestone on the ocean floor, thus removing CO2 from the air. Without weathering, CO2 emitted by volcanoes builds up in the atmosphere until the greenhouse effect is strong enough for ice to melt at low latitudes. Once melting begins, the amplifying snow/ice albedo feedback drives global deglaciation. Weathering then begins to reduce atmospheric CO2. This interplay of volcanism and weathering is the prime determinant of atmospheric CO2 levels on geological time scales.
- [14] Hansen J, Sato M, Russell G et al. Climate sensitivity, sea level, and atmospheric carbon dioxide. Phil Trans R Soc A 371, 20120294, 2013
- [15] Bauer SE et al. “Historical (1850-2014) aerosol evolution and role on climate forcing using the GISS ModelE2.1 contribution to CMIP6,” J Adv Model Earth Syst 12(8), e2019MS001978, 2020.
- [16] Intergovernmental Panel on Climate Change (IPCC). Climate Change 2021: The Physical Science Basis [Masson-Delmotte V, Zhai P, Pirani A et al. (eds)]. Cambridge and New York: Cambridge University Press, 2021
- [17] Forster PM, Smith C, Walsh T et al. Indicators of global climate change 2024: annual update of key indicators of the state of the climate system and human influence, Earth Syst. Sci. Data 17, 2641-80, 2025 https://essd.copernicus.org/articles/17/2641/2025/essd-17-2641-2025-supplement.pdf
- [18] Loeb NG, Johnson GC, Thorsen TJ et al. Satellite and ocean data reveal marked increase in Earth’s heating rate. Geophys Res Lett 48, e2021GL093047, 2021
- [19] von Schuckmann K, Cheng L, Palmer MD et al. Heat stored in the Earth system: where does the energy go? Earth Sys Sci Data 12, 2013-41, 2020
- [20] P.M. Forster et al., Supplement of Indicators of Global Climate Change 2023: annual update of key indicators of the state of the climate system and human influence Earth Syst. Sci. Data 16 (2024): 2625–58 https://doi.org/10.5194/essd-16-2625-2024-supplement
Support Earth Climate

About the Author: EARTH CLIMATE
Newsletter
Recent Comments
- America’s Climate Free Fall – CounterPunch.org – Theothernews on Climate Free Fall: Scientists Warn of Hidden Economic Crisis, Earth’s Systems Become Dangerously Unstable
- Climate Researcher Levermann: "We Must Understand What Happens After Climate Systems Tip" | EarthClimate on Climate Free Fall: Scientists Warn of Hidden Economic Crisis, Earth’s Systems Become Dangerously Unstable
- Extreme Temperature Diary- Saturday July 18th, 2026/Main Topic: The “Super” El Niño of 2026: Why 2027 Will Be a Year That Is Off the Chain Hot – Guy On Climate on The “Super” El Niño of 2026: Why 2027 Will Be the Year the World Watches
Support
We create visually compelling, accessible science content that transforms complex research into engaging videos and articles, helping millions understand the discoveries shaping our world. [Paypal | Patreon]

Hansen’s recalibration of climate sensitivity to 4-5°C for doubled CO2—supported by four independent lines of evidence from ice ages to satellite data—fundamentally challenges the narrative we’ve been operating under, and if correct, means we’re staring at far more committed warming than IPCC models have led the public to believe. What makes this projection so valuable isn’t just the bold call that 2026 will break the 2024 record, but the explicit laying out of scientific reasoning behind it, which creates an opportunity for genuine scientific learning rather than the opacity that often clouds climate modeling. The divergence between Hansen’s assessment and Zeke Hausfather’s 26.6% probability for 2026 being warmest highlights a critical problem: we have major disagreements among climate scientists about fundamental parameters—aerosol forcing, climate sensitivity, cloud feedbacks—yet the public hears these as settled science. The double whammy Hansen identifies—higher climate sensitivity plus additional warming from aerosol reductions—suggests that even our most concerning climate scenarios may be underestimating the speed and magnitude of change in the coming decades. Whether the “thoroughbred” or the “fading nag” finishes first come November will provide a data point, but what we really need is a scientific culture willing to acknowledge deep uncertainties and revisit foundational assumptions rather than defending established models.