Arctic Sea Ice Spiral (2013)
Visualization of Arctic sea ice volume, showing the evolution of sea-ice over time from 1979 to July 2013. Pitch of the notes are proportional to the average sea-ice volume for each month.

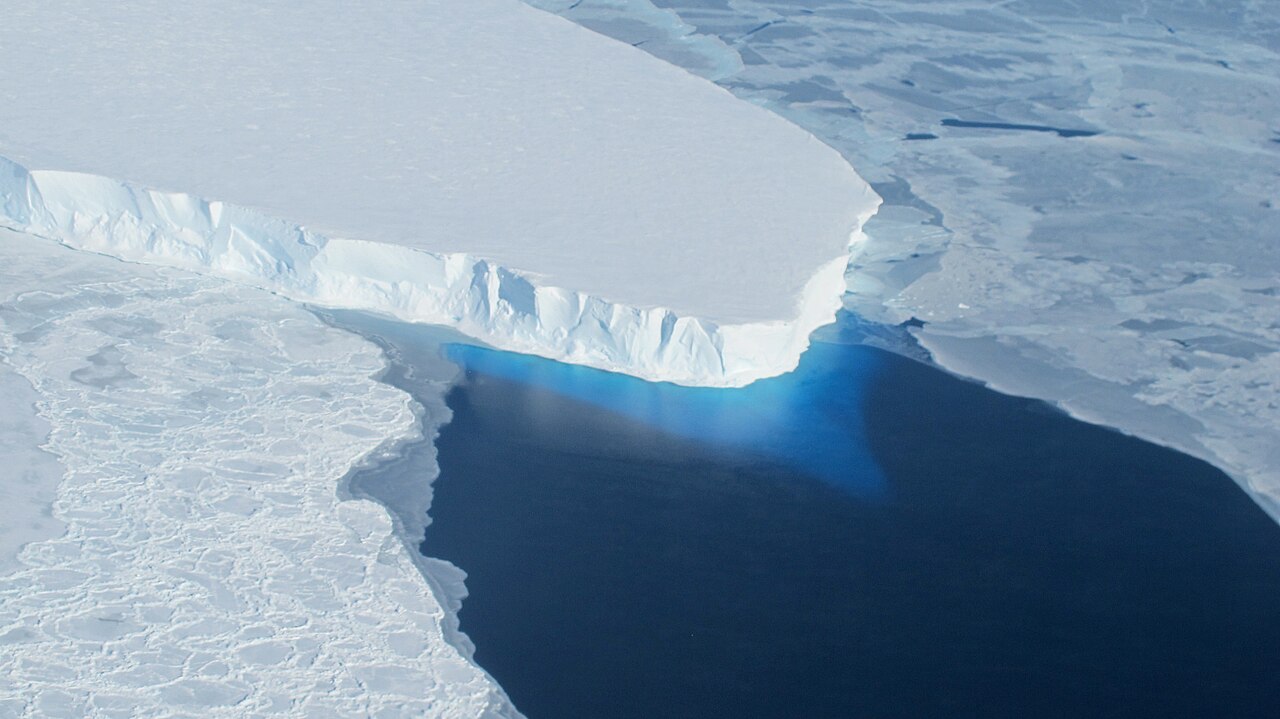
About the data: Sea Ice Volume is calculated using the Pan-Arctic Ice Ocean Modeling and Assimilation System (PIOMAS, Zhang and Rothrock, 2003) developed at APL/PSC.
Source data for this graph is available from http://psc.apl.washington.edu
Categories: Arctic, Climate Change, Cryosphere, Environment, Science, Sea Ice, World News
Support Earth Climate

About the Author: Andy Lee Robinson
Newsletter
Join 117 other subscribers.
Subscribe
Login
0 Comments
Oldest
Newest
Recent Comments
- America’s Climate Free Fall – CounterPunch.org – Theothernews on Climate Free Fall: Scientists Warn of Hidden Economic Crisis, Earth’s Systems Become Dangerously Unstable
- Climate Researcher Levermann: "We Must Understand What Happens After Climate Systems Tip" | EarthClimate on Climate Free Fall: Scientists Warn of Hidden Economic Crisis, Earth’s Systems Become Dangerously Unstable
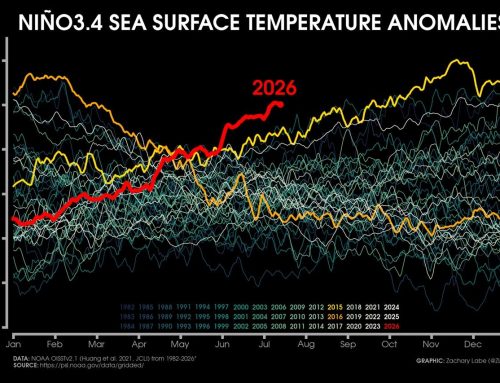
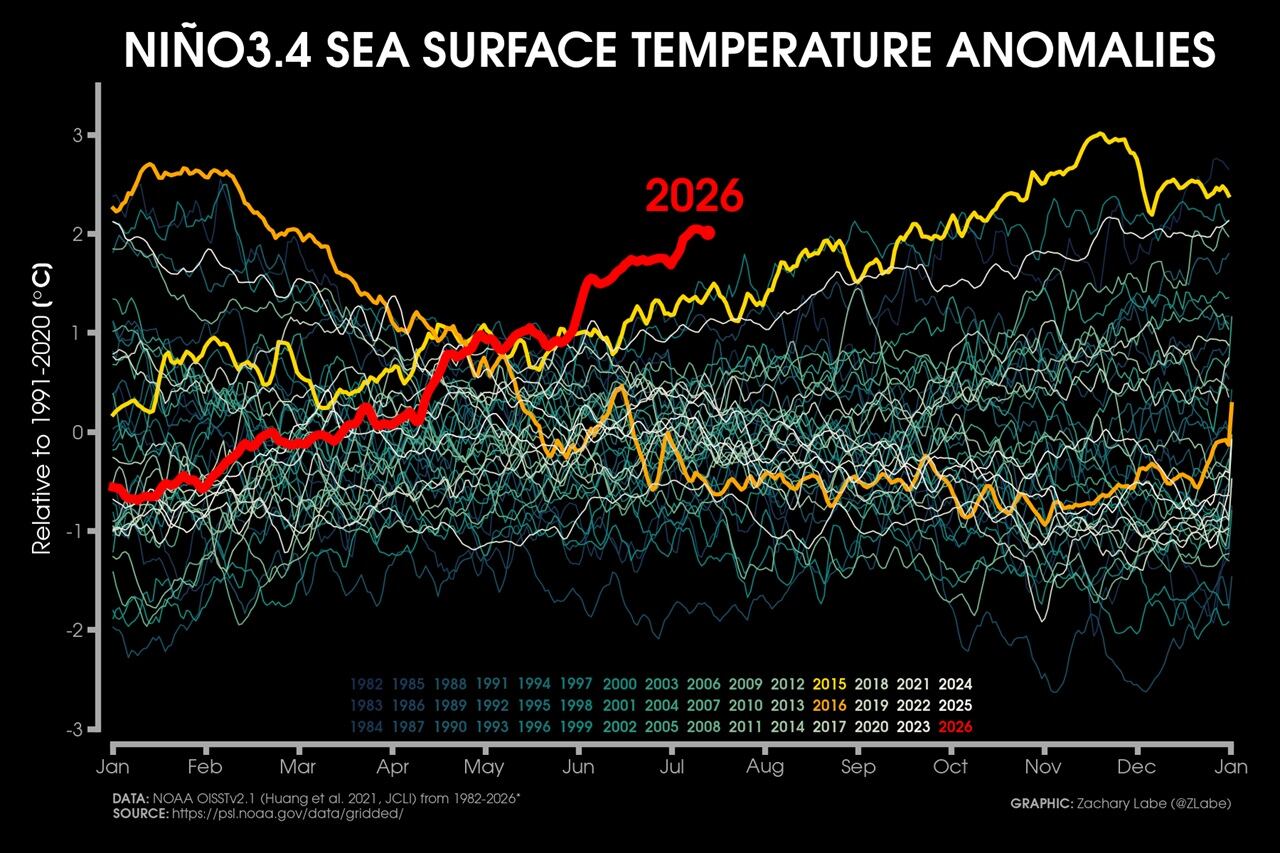
- Extreme Temperature Diary- Saturday July 18th, 2026/Main Topic: The “Super” El Niño of 2026: Why 2027 Will Be a Year That Is Off the Chain Hot – Guy On Climate on The “Super” El Niño of 2026: Why 2027 Will Be the Year the World Watches
Support
We create visually compelling, accessible science content that transforms complex research into engaging videos and articles, helping millions understand the discoveries shaping our world. [Paypal | Patreon]