Global Warming by Latitude Zone (1880-2022)
This visualization shows global temperature changes per latitude zone from 1880 to 2022, illustrating that the Arctic is warming much faster than other regions on Earth.

Discover the non-uniformity of global warming through this informative visualization! See how temperature changes vary across latitudes since 1880. Learn how the Arctic is warming at an alarming rate compared to other regions on Earth. Explore temperature anomalies based on NASA data relative to a base period of 1951 to 1980.
These changes, called “anomalies” (how much warmer or cooler something is compared to an average), are defined relative to a base period of 1951 to 1980 and are based on NASA data.
Support Earth Climate

About the Author: EARTH CLIMATE
Newsletter
Recent Comments
- America’s Climate Free Fall – CounterPunch.org – Theothernews on Climate Free Fall: Scientists Warn of Hidden Economic Crisis, Earth’s Systems Become Dangerously Unstable
- Climate Researcher Levermann: "We Must Understand What Happens After Climate Systems Tip" | EarthClimate on Climate Free Fall: Scientists Warn of Hidden Economic Crisis, Earth’s Systems Become Dangerously Unstable
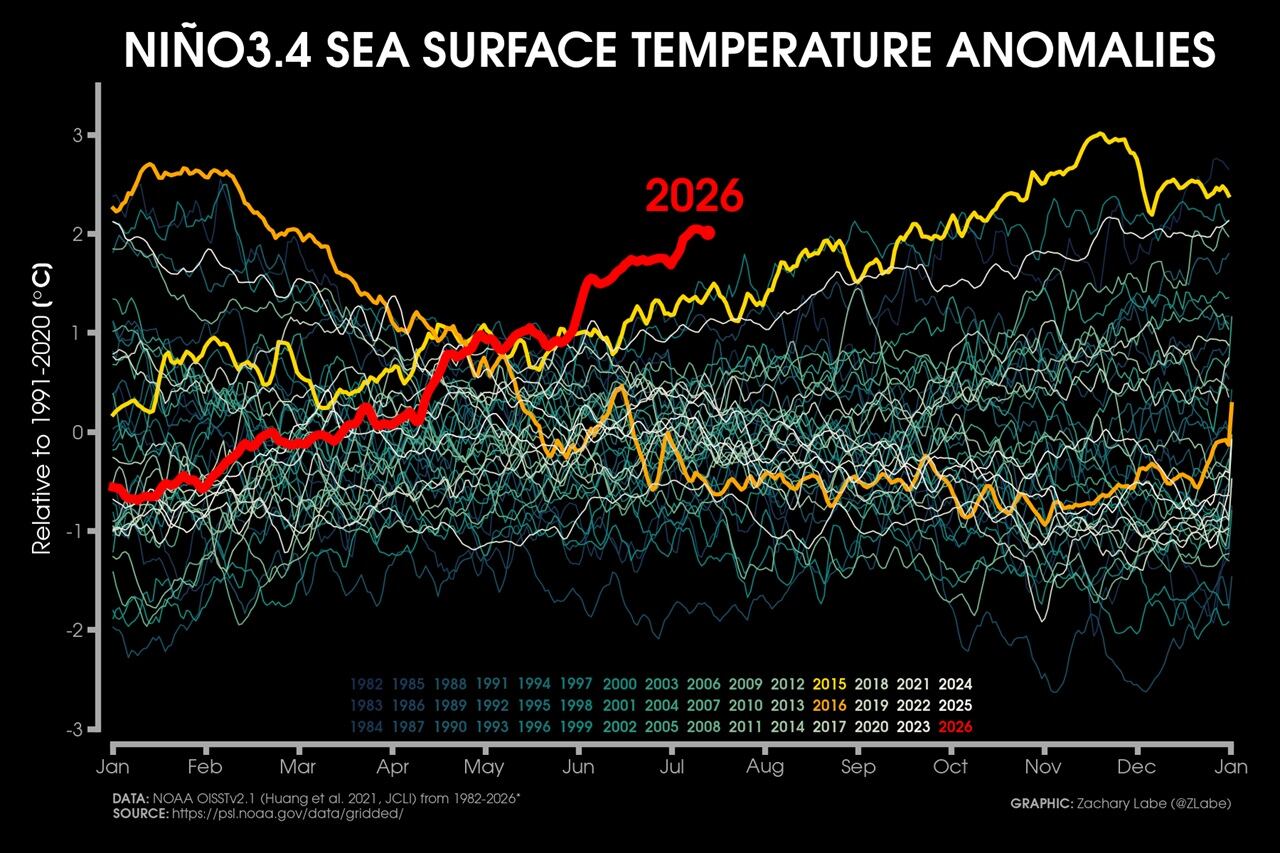
- Extreme Temperature Diary- Saturday July 18th, 2026/Main Topic: The “Super” El Niño of 2026: Why 2027 Will Be a Year That Is Off the Chain Hot – Guy On Climate on The “Super” El Niño of 2026: Why 2027 Will Be the Year the World Watches
Support
We create visually compelling, accessible science content that transforms complex research into engaging videos and articles, helping millions understand the discoveries shaping our world. [Paypal | Patreon]